How To Use
Upload File
In our application the first tab is for uploading data file. The file will not be uploaded in the server. It will be uploaded temporarily in the user’s browser cache. So during working on one data file, if user refreshes the browser from any of the system page, then the data file needed to be uploaded again. System allows CSV and XLS formatted data file only.
Click on the “Browse” button and system will open a popup window where user can select the file to be uploaded. After the file is uploaded successfully, then a success message will appears below the “Browse” button and the “Next” button will be active and user can go the next step.
* There is another optional file can be uploaded with the Label of the Variables. This file upload facility is optional. If this file is not uploaded, then system will create the Variable Label from the Variable Name by default.
Fig: Upload data
Supported File Format
System allows CSV and XLS formatted data file only. User can not upload other types of file.
Required File Structure
Scatter Plot with Trace
Grouped/Stacked Bar
Line Chart with Area Plot
Sunbrust
Panel Chart
Bar to Pie
View Uploaded Data
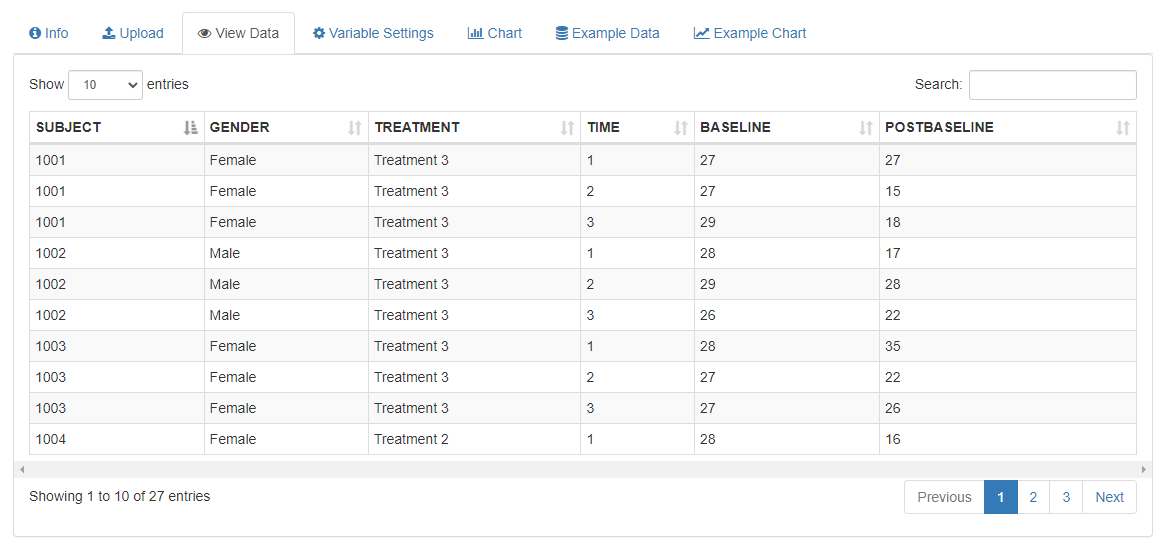
After successful data upload, system will go to this tab where users can see the uploaded data in a tabular format. There is a “search” option on rightmost part of the table. User can search any data using this search option.
Fig: View data
Variable Settings
In the “Variable Settings” tab, users can choose which variable will be available under which section. This section will ensure that the selected variables will appear under specific role selection.
If additional variable label file is also uploaded, system will try to match the variable names and then get the corresponding variable labels from that file.
Fig: Variable settings
Update Variable Label
User can also update the “Variable Label” here. Click on the “pencil” icon beside every Variable Label.
Fig: Update variable label
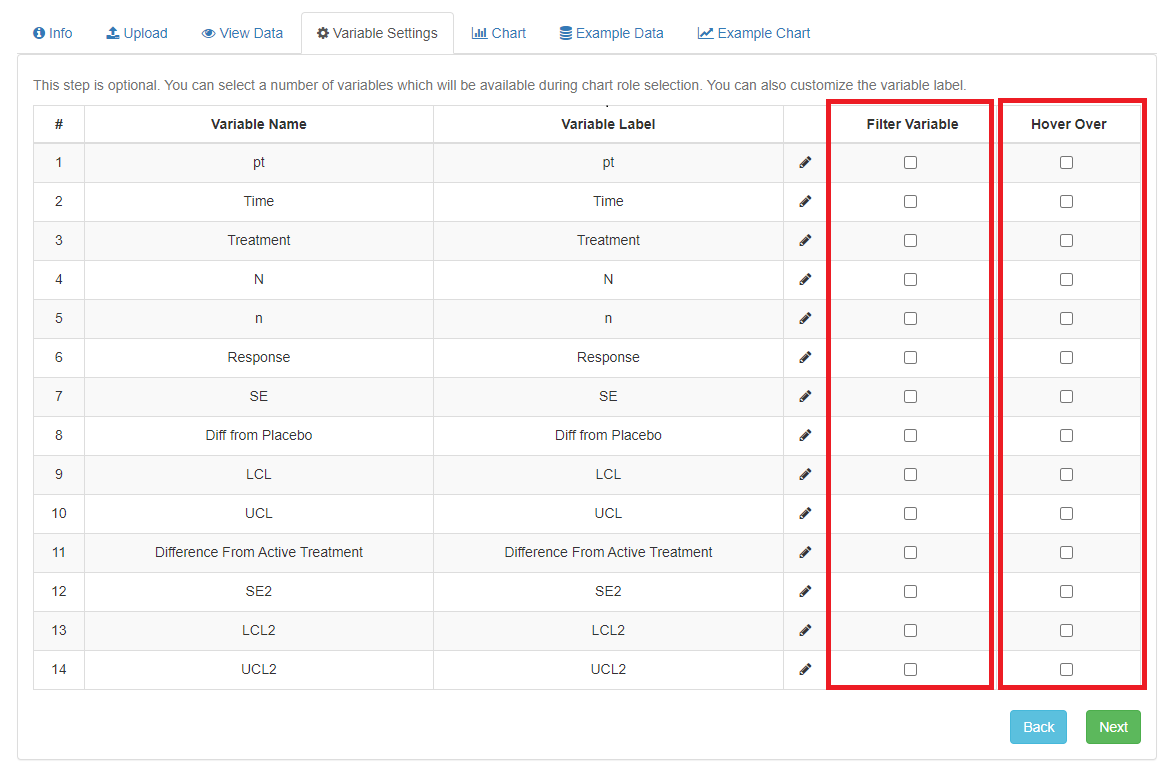
Filter, Hover Option
User can select which variables go in filter section and which variables will show when user hover over the chart.
Fig: Filter, Hover Option
Chart
In the Chart page, there are four sections: Chart area, Select Role area, Legend area and the Settings area including one “Play” button to animate the chart.
Fig: Chart
Chart area
- “Chart” area shows the chart itself using the default settings of the chart.
- Chart will only show the points for a specific time points, not for all times all together.
- Position for chart points for a time which is not present in the source data is also calculated using moving average.
- Transition is used for smooth moving of the chart points and for animation
Select Role
In the “Select Role” area user can select the “Category”, “Time X-axis”, “Y-axis” and value of “N” from the dropdown. Values of each dropdown lists come from the selected roles in the “Variable Settings” page. Click on the “Update Chart” button. It will update the chart based on the roles defined in this area.
Legends area
“Legends” area provides the list of legends with different color as they appear in the chart. There is a check box beside every legend. Uncheck one makes that disappears from the chart.
Animating The Chart
- There is a “Play” button under the chart area which. Click on the button and it will animate the chart over time.
- Animation can be played either by using the play button or by clicking on different time point in the slider.
Chart Settings
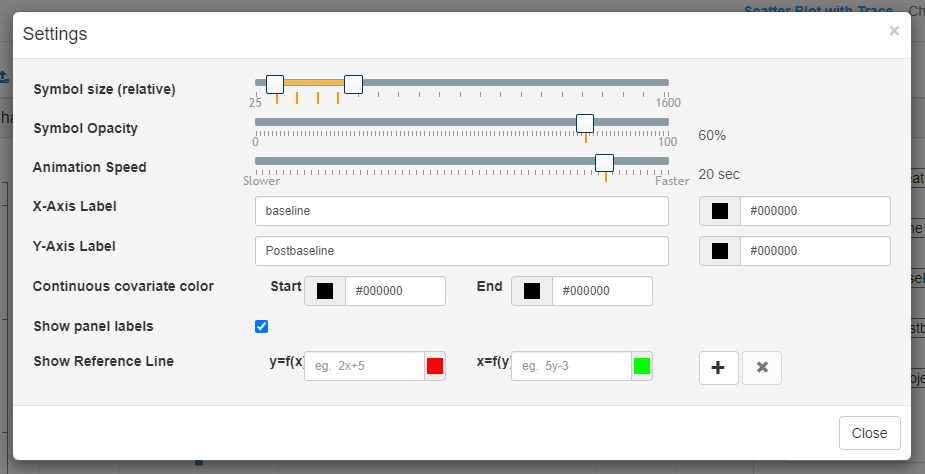
There is a setting button on the right side of the top of. This will open a pop up of “Settings” area. Settings area provides facility to change the basic settings in the chart. User can change the symbol size, animation speed, symbol opacity and also to change the icon and the color of the symbols in runtime. User can also show a “Reference Line” in the chart using this area. The settings area is appeared on the top of the chart in transparent, so that user can see the changes in chart on runtime.
Fig: Chart Settings
Symbol Size
User can change the size of the symbols used in the chart using a slider. The size of the symbol depends on the maximum and the minimum value of the data
Speed
User can change the speed of the animation using this slider. It indicates how much time it will take to finish the chart animation. User can define the speed in seconds.
X-axis Label
Using this text area, user can change the label of X-axis label in runtime. There is also a color picker box beside the text area where user can change the color of the axis label.
Y-axis Label
Using this text area, user can change the label of Y-axis label in runtime. There is also a color picker box beside the text area where user can change the color of the axis label.
Example Data & Chart
Example Data
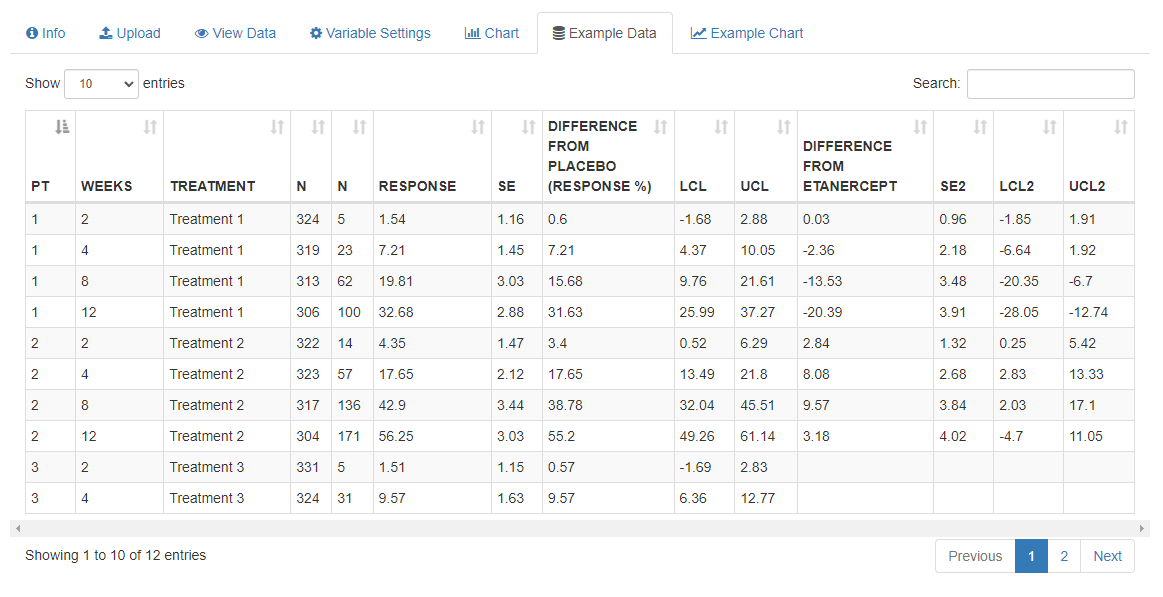
There is a tab for example data where users can see how the data should be structured
Fig: Example Data
Example Chart
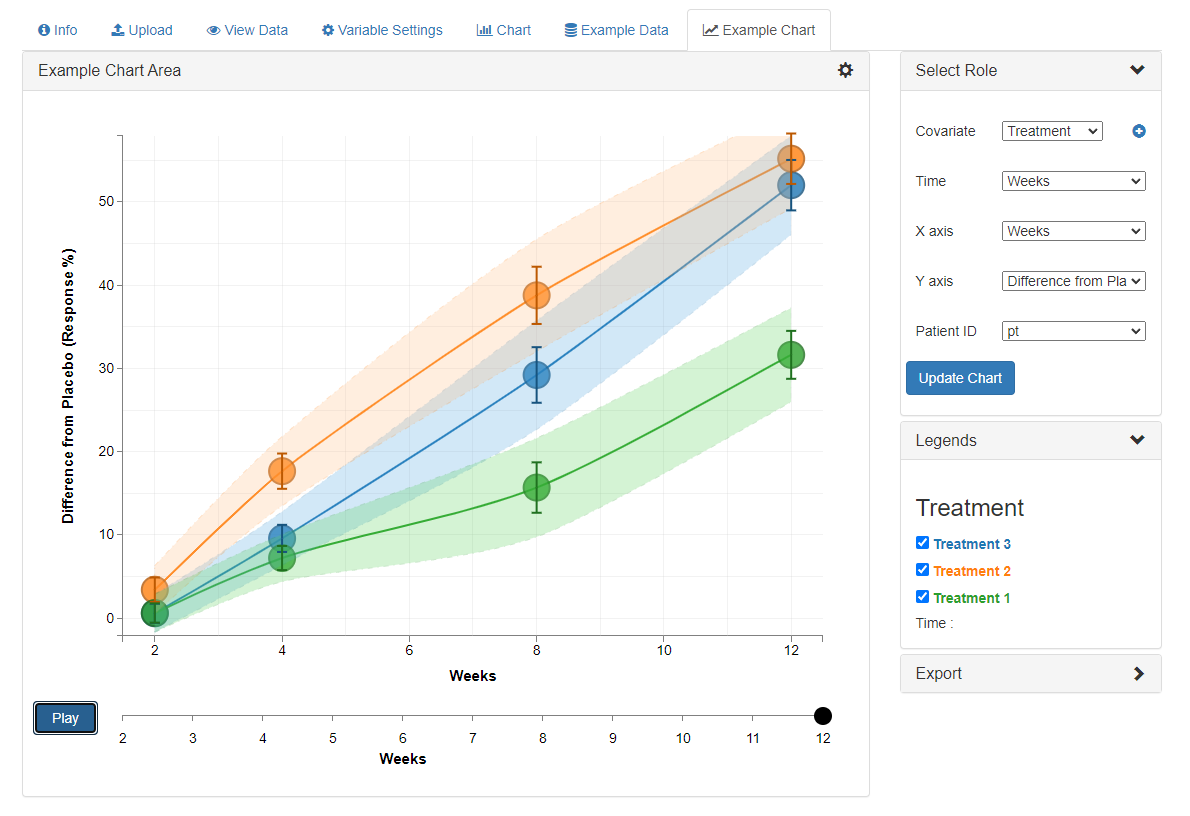
Example chart tab shows the chart based on the example data.
Fig: Example Chart
Downloading Chart
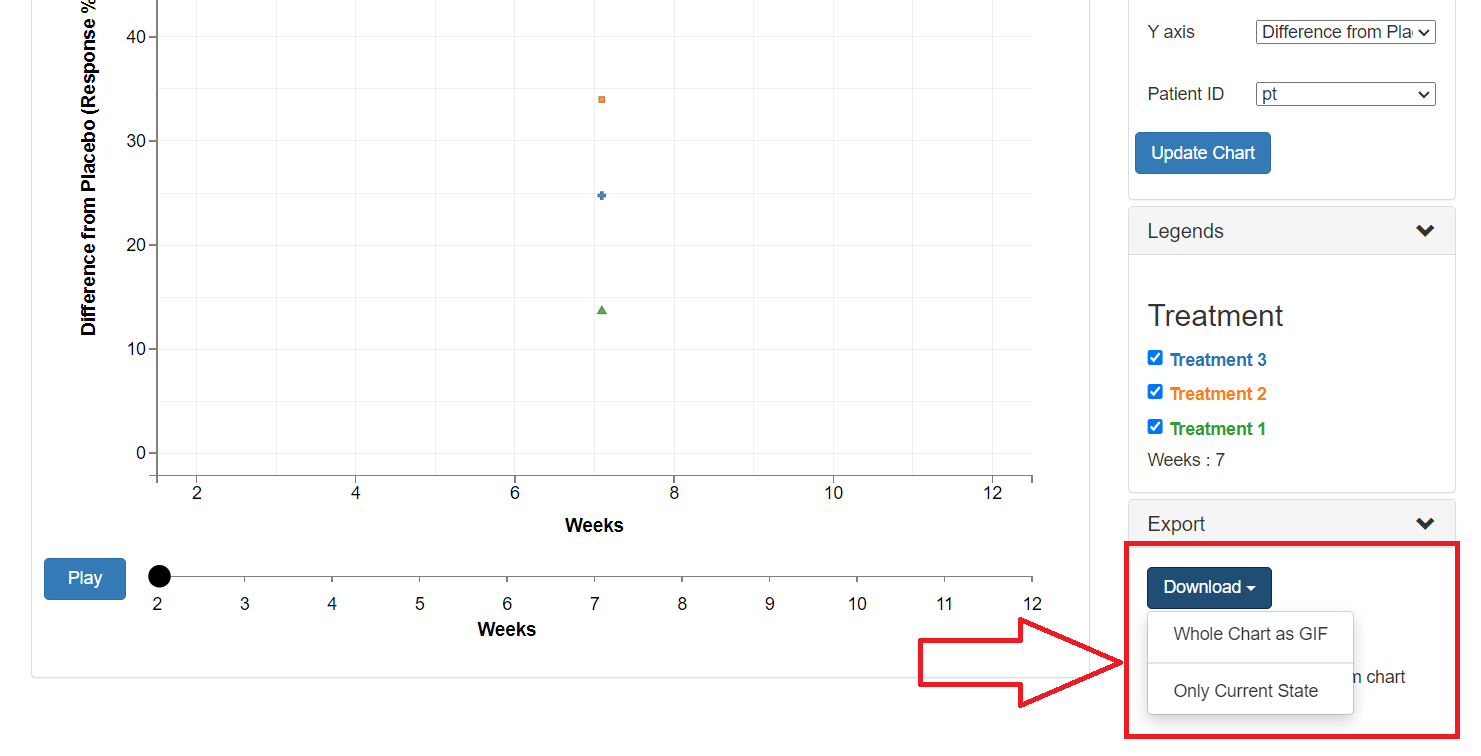
Fig: Download Chart As GIF and current state
Download Chart As GIF/Current State
Users can download the chart as gif image/current state as shown in the screenshot.
Copyright © 2024. Shafi Consultancy Ltd. All rights reserved.
Registered in England and Wales No. 4194731
